Documentation sections
Analytics
Statistics
What the filter did with your traffic. Money is covered in detail in Reports.
By default, statistics open for the last 7 days.
You can customize the section layout; see Customizing section layouts.
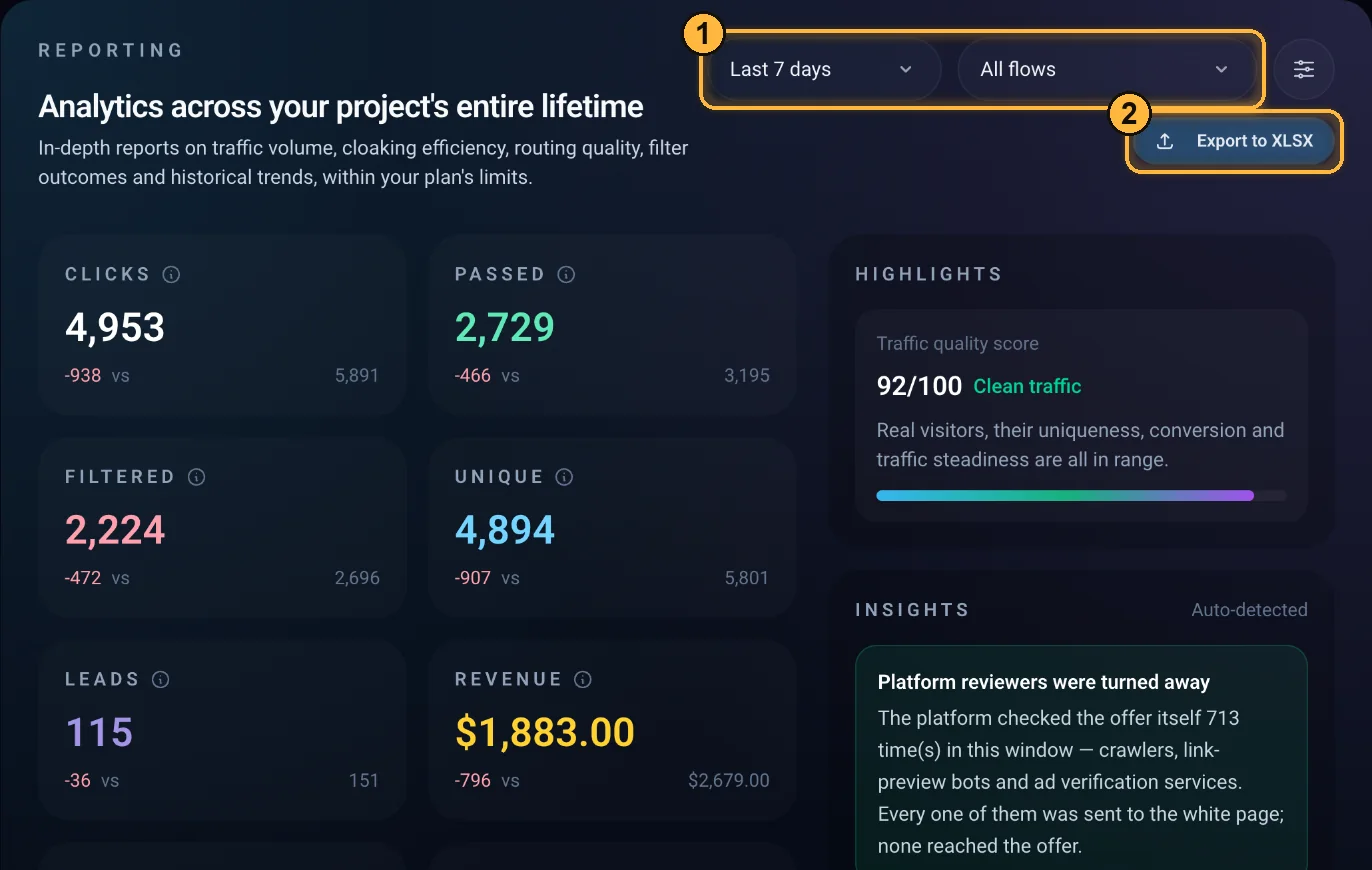
- Cards: Clicks, Passed, Filtered, Unique, Leads, Revenue; Cost and Profit if there was spend in this period or the previous one.
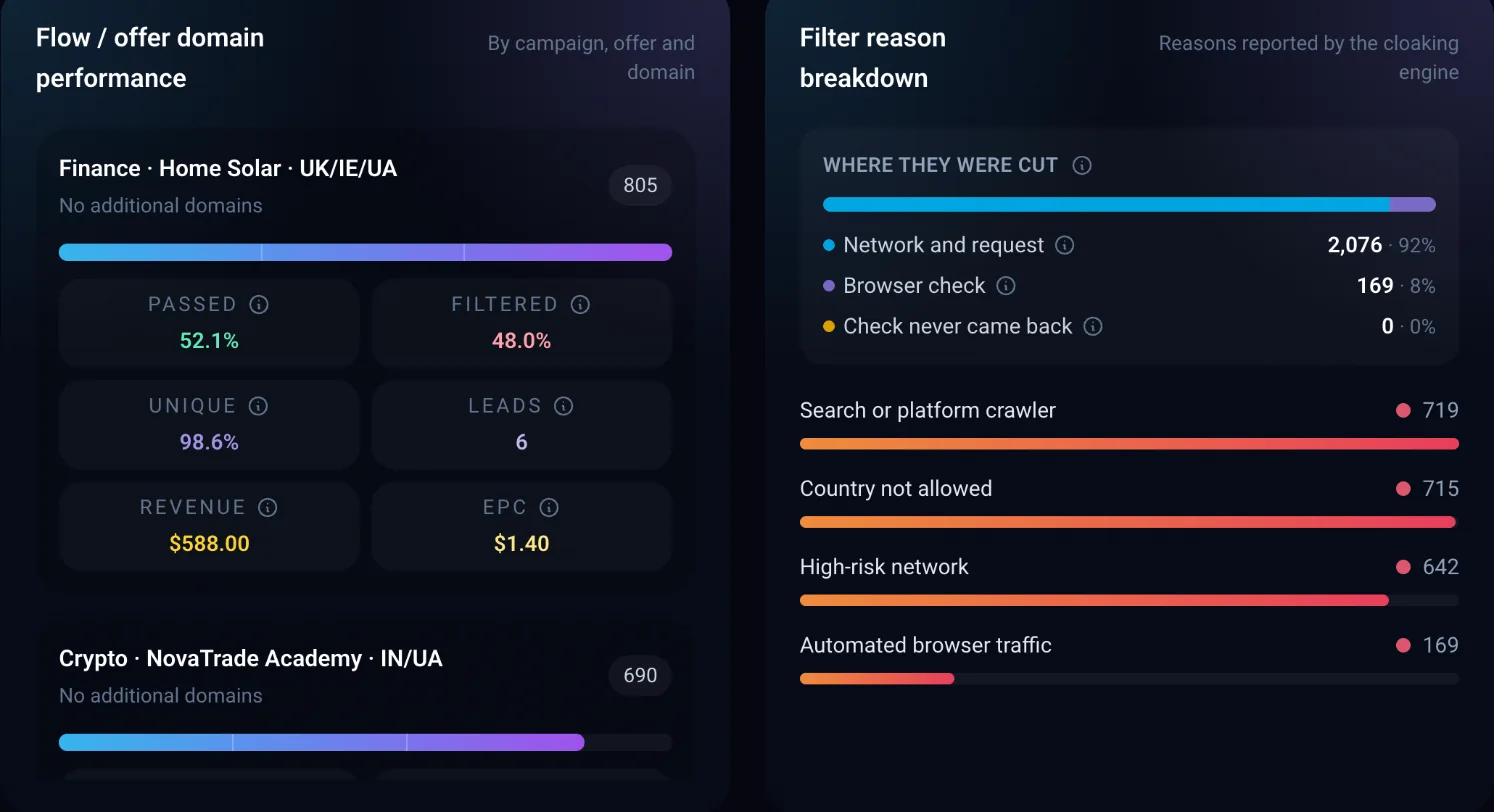
- Above the block reasons is the “Where they were cut” block: what share of visits was cut at each of the three steps: network and request, browser check, check never came back.
- Blocks: quality index, window comparison, traffic mix with CR (the share of conversions among passed clicks) and EPC (revenue per passed click), trend, hourly map, rhythm by hour and weekday, flows and offers, block reasons.
- Breakdowns: GEO, devices, OS, browsers, ISPs, destinations (how much traffic went to each offer and to the White Page), up to 100 values each.
- The rhythm and all dates are in the time zone from your profile.
- Export to XLSX: the breakdown tables (flows, GEO, devices, browsers, ISPs, block reasons, OS, directions) and money by the sub1–sub10 tags. Charts, period comparison and the hourly map aren't in the file.
ArtisanClo · Dashboard documentation. Questions — info@artisanclo.com or @artisanclo_support on Telegram.