Documentation sections
Reference
System status
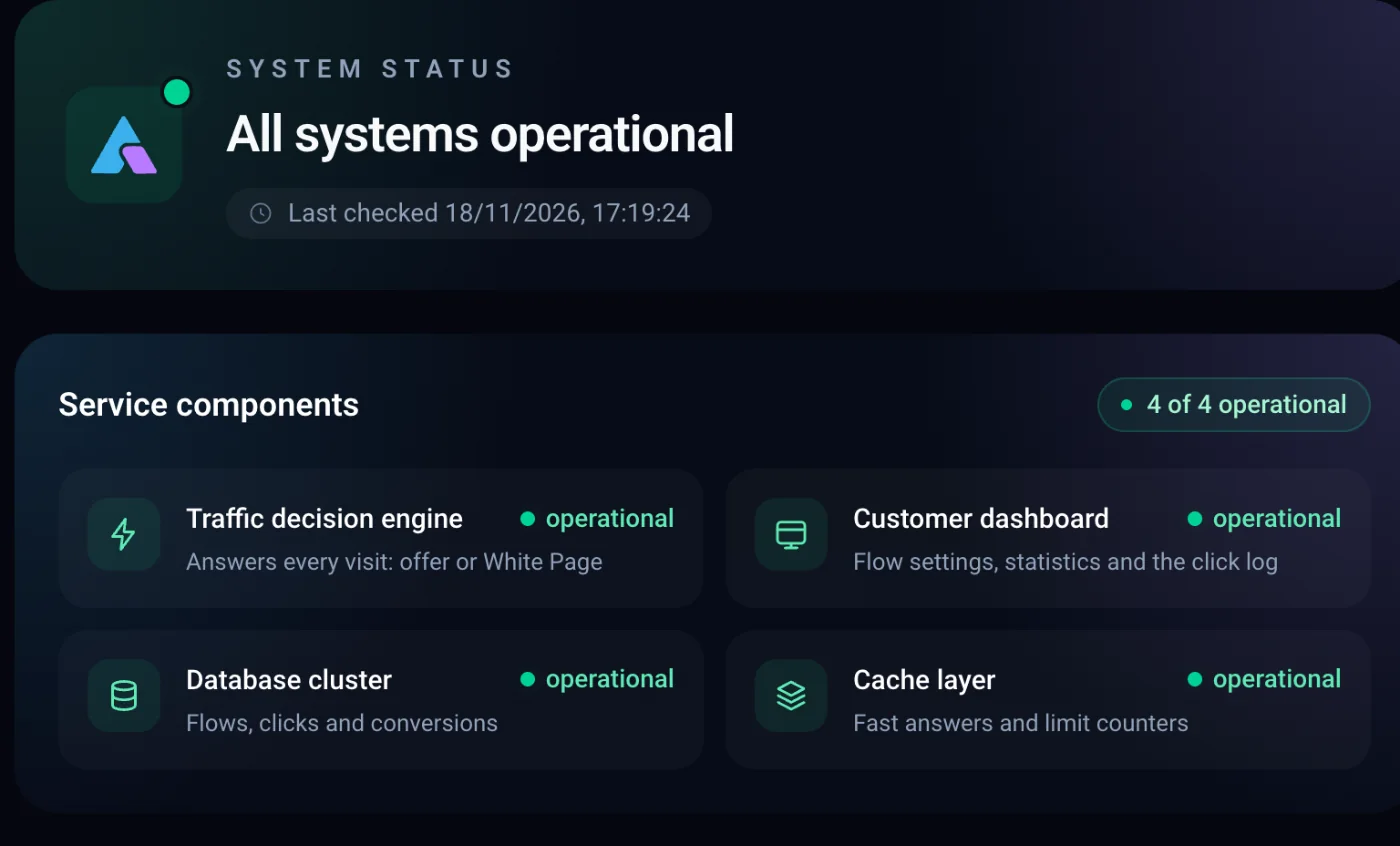
The artisanclo.com/status page shows whether the decision engine (the service that makes decisions on visits), the dashboard, the database and the cache are working. It also opens at a language-specific address, for example artisanclo.com/en/status. For external monitoring there's artisanclo.com/status.json: the same data, with a 200 code when everything works and 503 if any component is down.
- “Verdicts processed”: the share of requests (not clicks) handled without failure over 30 days.
- “Decision response time”: the average over the last 24 hours on our side, in milliseconds. Next to it are “Full response” (including the IP check and click logging) and “Decision in the browser” (how long the visitor's browser waits, network included).
- The “Availability” block labeled “target 99.9%”.
- A daily bar for 30 days in four colors: “No failures”, “Some errors”, “Failures”, “No requests”.
- The event log: up to the 20 latest hours in which 1% or more of decisions failed.
Component status is recalculated every 30 seconds, request statistics every 5 minutes. Refresh the page to see the latest data.
ArtisanClo · Dashboard documentation. Questions — info@artisanclo.com or @artisanclo_support on Telegram.